

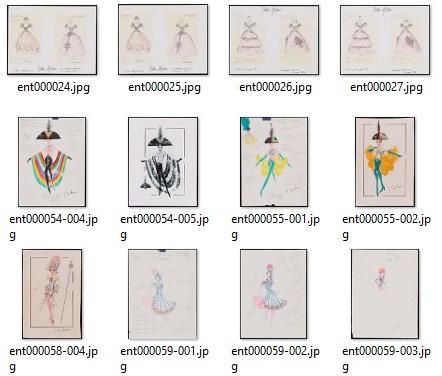
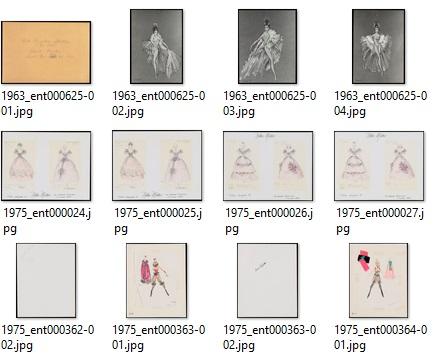
Images 1 & 2: Before (top) and after (bottom) item renaming process.
After providing an introduction to digital humanities and collections as data in her previous blog post, Doris Morgan Rueda now provides insight into the exploratory work she is conducting with Thomas Padilla using over a thousand scanned images of costume designs that were digitized as part of our LSTA entertainment grant.
To start understanding Collections as Data we began by looking at the collection and developing research questions that the collection could potentially answer. The Entertainment Collection had a large group of costume designs from a handful of Las Vegas shows. We began to speculate if it was possible to map the costume designs in a way that could reveal trends in costume designing from the mid-1960s to the early 2000s. We wanted to find out how the style of Las Vegas entertainment had developed through the latter half of the 20th century. To answer this, we used data visualization software that could analyze over a thousand costume design images. This process proved to be complicated, but it provided the opportunity to ask critical questions of collections and metadata.
Navigating and interacting with the collection metadata was our first hurdle. The metadata provided to us listed each item with a unique ID code (ex: ent000562). This code, while useful for researchers or librarians trying to find a specific item, was not as useful for data visualization. The code does not include any chronological information, meaning the data would not be visualized in chronological order if inputted it in its original format. To solve this, we renamed each item by copying the each item’s date into the beginning of the original file name. Due to some but not all items having specific day and month information, we decided to only use the year. Other items had more than one year listed while there was also the occasional item with no date attached. For the purposes of this project, we made the decision to exclude these items to have a workable data set.
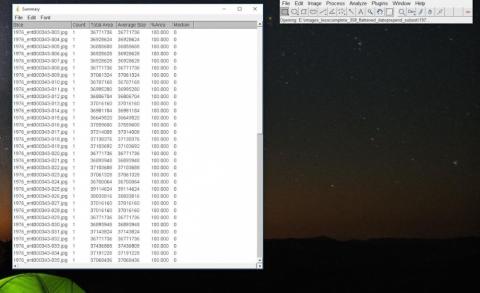
Image 3: Having renamed the data into a chronologically representative naming convention we were able to process the images and prepare them for visualization.
Once our data set was formatted to the specific data we hoped would help answer our initial question, it was time to feed it into the analytic program. This resulted in a list of the hue, saturation, and brightness of each item. Using this new data set, we were able to visually map differences in the images over time along a traditional XY graph. Because of the three units of measurement, we also had the ability to play with how the data was graphed. This revealed different peaks and trends, often organizing the data in unexpected ways. Groupings of costume designs that included feathers and hoop skirts appeared when organized by saturation, but disappeared with other configurations of the XY axis.
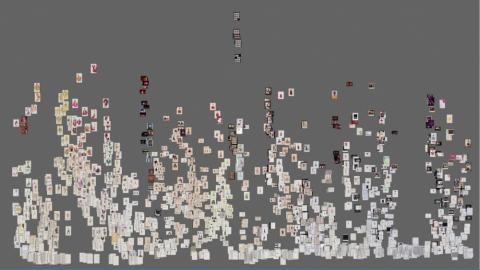
Image 4: Organizing the data by filename and saturation standard deviation revealed some unique groupings of not only color but shape and possibly costume material.
This process, from obtaining the metadata to the finished visualization took about four days of collaboration to install the software, prepare the data, and run the data before we got the final visualizations. Although we had originally thought it would be an easier process, the questions of how data is organized, how we should input the data, and the type of information that should be included or could be included in item metadata arose from this process. Our frustrations continued to bring us closer to the meaning of Collections as Data in practice.
In her final blog post, Morgan Rueda will consider the issues and problems that occurred in this initial foray into Collections as Data work, and discuss what she wishes she would have known prior to beginning her research.
Doris Morgan Rueda is a doctoral student in the UNLV History Department. Her research focuses on the development of juvenile justice systems in the American Southwest with a special interest in international juvenile justice and race in the twentieth century. Her work uses interdisciplinary methods and a transnational approach to explore the representation and racialization of juvenile delinquency in border towns through legal systems and popular images.